24 May 2021
We begin by importing the data we are goin to use. You can dowload the data from here.
clear all
import delimited "folder-containing-the-file\psoy.csv"
We must add a month variable, and give time series format
gen month=monthly(mes,"YM")
format month %tm
tsset month
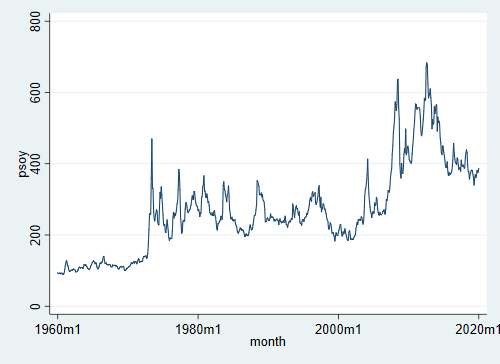
Let’s plot our data
tsline psoyThe above time series si not stationary at all. So we apply logaritmic difference:
gen lns=ln(psoy)
gen dlns=D.lns
tsline dlns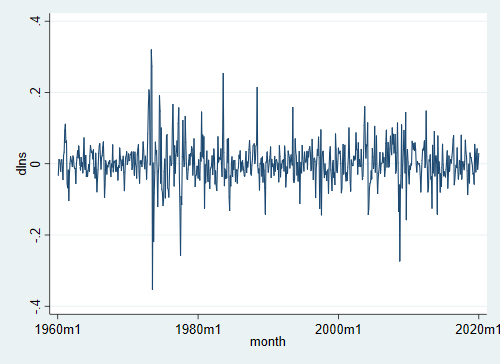
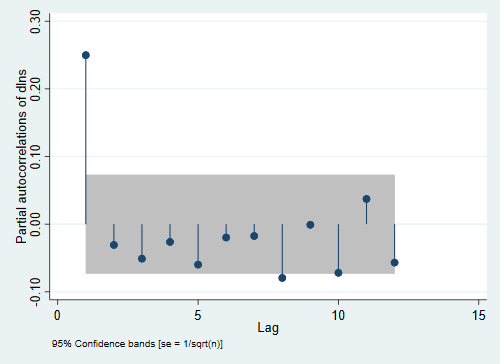
Is it auto correlated?
corrgram dlns, lags(12)
ac dlns, lags(12)
pac dlns, lags(12)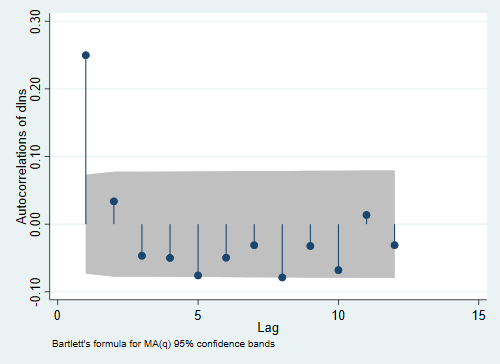
Let’s try to estimate an AR(1)
arima dlns, ar(1)(setting optimization to BHHH)
Iteration 0: log likelihood = 1067.751
Iteration 1: log likelihood = 1067.7511
Iteration 2: log likelihood = 1067.7511
Iteration 3: log likelihood = 1067.7511
Iteration 4: log likelihood = 1067.7511
ARIMA regression
Sample: 1960m2 - 2020m1 Number of obs = 720
Wald chi2(1) = 149.70
Log likelihood = 1067.751 Prob > chi2 = 0.0000
─────────────┬────────────────────────────────────────────────────────────────
│ OPG
dlns │ Coef. Std. Err. z P>|z| [95% Conf. Interval]
─────────────┼────────────────────────────────────────────────────────────────
dlns │
_cons │ .0019588 .0028895 0.68 0.498 -.0037045 .007622
─────────────┼────────────────────────────────────────────────────────────────
ARMA │
ar │
L1. │ .2495429 .0203956 12.24 0.000 .2095683 .2895176
─────────────┼────────────────────────────────────────────────────────────────
/sigma │ .0549165 .0006728 81.62 0.000 .0535979 .0562352
─────────────┴────────────────────────────────────────────────────────────────
Note: The test of the variance against zero is one sided, and the two-sided
confidence interval is truncated at zero.
Are its residuals white noise?
predict resid_ar1, resid
wntestq resid_ar1
Portmanteau test for white noise ─────────────────────────────────────── Portmanteau (Q) statistic = 55.4994 Prob > chi2(40) = 0.0524
Let’s se visually how acurate are the fitted values
predict dlns_ar1
tsline dlns dlns_ar1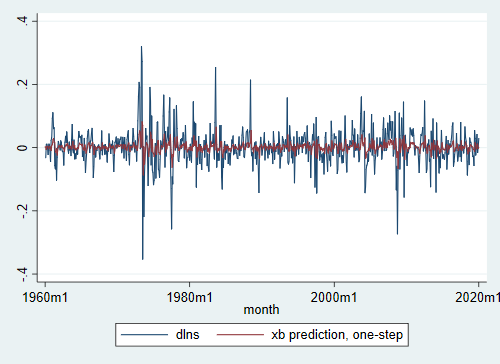
This code is just an example, in order to developed a better model one should follow the Box-Jenknis method.